Getting ready for an operating loan renewal at 7% rates
Published · 7 min read
What are farm operating loan rates right now?
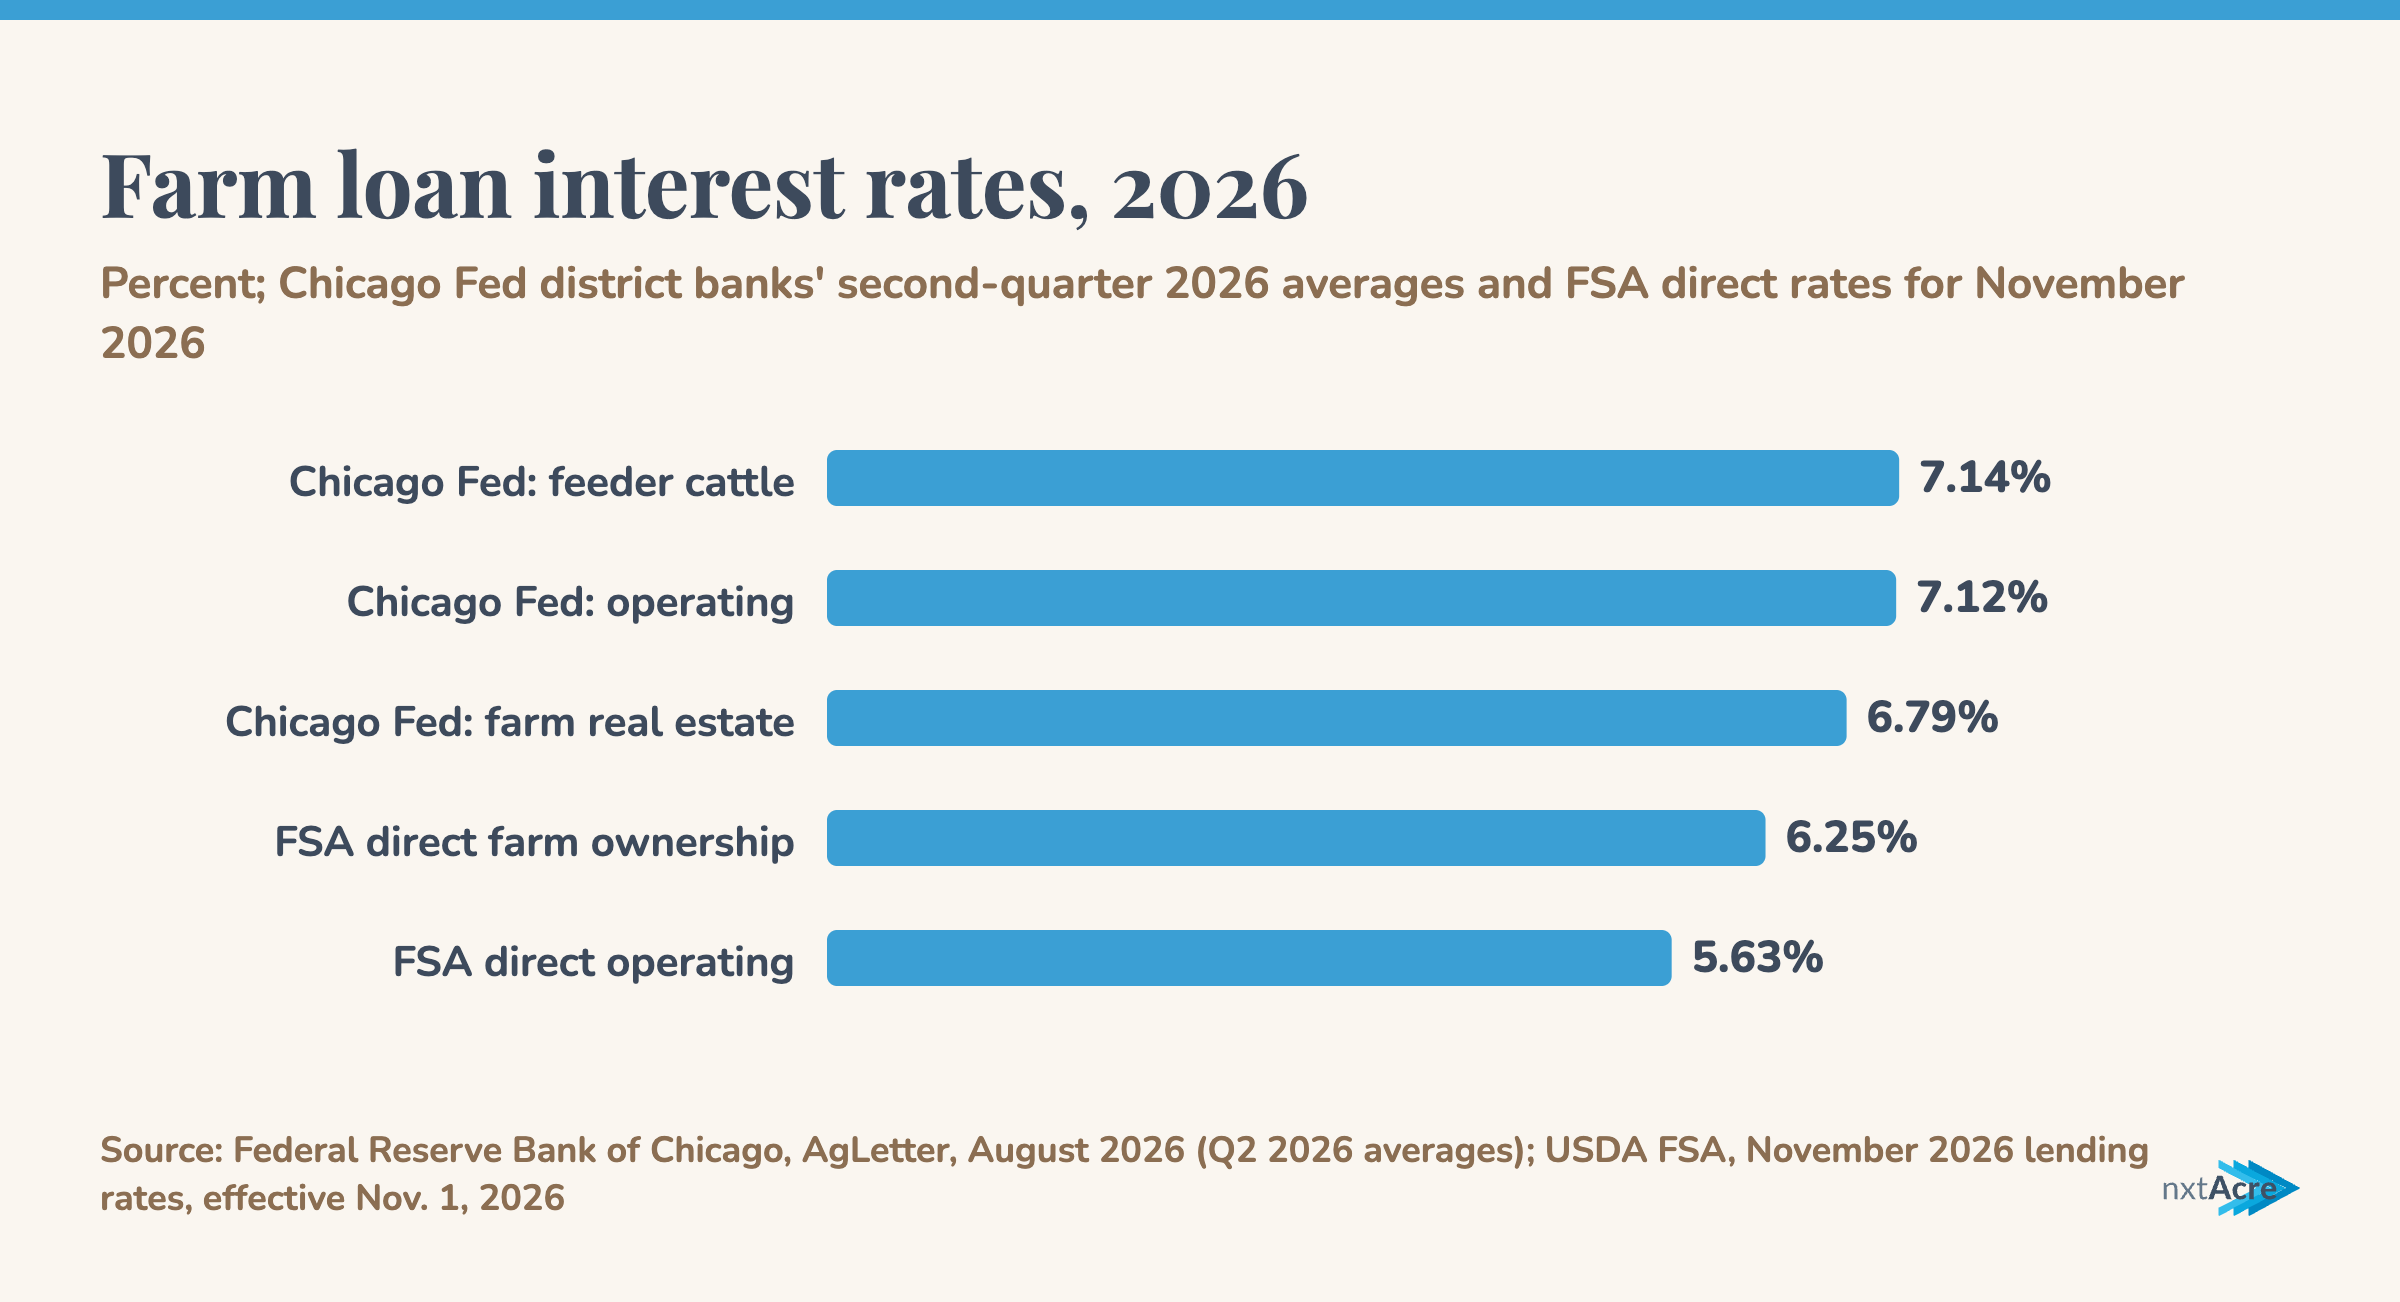
A little over 7% at the bank. Agricultural banks in the Chicago Fed's district averaged 7.12% on operating loans in the second quarter of 2026, according to the August AgLetter. Feeder cattle loans averaged 7.14% and farm real estate loans 6.79%. All three were up a little from the first quarter, when operating loans averaged 7.08%.
FSA's direct loans cost less if you qualify. For November 2026, the direct farm operating rate is 5.625% and the direct farm ownership rate is 6.25%, effective Nov. 1. In October the direct operating rate was 5.375%. FSA announces new rates every month, so check the current one before you apply.
Rates weren't the only thing that moved. In the same Chicago Fed survey, the average loan-to-deposit ratio at the district's banks rose to 80.7%, the highest since the data series began in the 1970s. And 27% of responding lenders said farm loan repayment rates were lower than a year earlier. None said higher.
That's the setting for this winter's renewals. You'll have a better meeting if you've worked your own numbers first.
What lenders ask for at renewal
Aaron Smith, an extension economist at the University of Tennessee, put out a loan renewal checklist in February 2025. It starts with tax returns, an income statement, a balance sheet, and cash flow projections and budgets. Then it adds:
- Last year's production or yield history, or your crop insurance records, for each crop and livestock enterprise
- Every outstanding loan, with its terms and payments
- Crops and products carried over into the next fiscal year
- Planned capital purchases
- A projection and budget for the coming production year
- Your risk management and marketing plan
- A succession plan
Smith boils down what lenders weigh to five things: repayment, liquidity, solvency, collateral and the relationship. Under relationship he lists the quality and timeliness of the information you hand over. A complete file that shows up on time counts for something.
In nxtAcre, the Lender Package report builds most of that file from your books: a balance sheet split into current, intermediate and noncurrent with cost and market columns, accrual-adjusted net farm income, the standard farm financial ratios, a debt schedule, a statement of owner equity and a 12-month cash-flow projection, all in one PDF you can hand the loan officer. You can also give your accountant their own login to check the numbers before you sit down at the bank.
How should you put the balance sheet together?
Date it the same way every year, and value things the way the extension guides do. Iowa State's Ag Decision Maker guide to the balance sheet says most farm families date theirs Dec. 31 or Jan. 1, the end of their accounting year, and that comparing year-end statements over several years helps measure progress.
A few rules from that guide change the numbers lenders look at first:
- Value crops at the current market price or your contracted price, minus marketing costs.
- List principal payments due on term debt in the next 12 months as a current liability. Only the rest of the balance goes with long-term debt.
- Include interest that has built up but isn't paid yet. Iowa State figures it as each loan's outstanding principal, times its interest rate, times the fraction of a year since the last payment.
That last formula is also the plain way to see what a line of credit costs you at today's rates: the balance, times the rate, times the share of the year the money was out.
Why does the lender want more than your Schedule F?
Because a tax return can make a year look better or worse than it really was. Iowa State's income statement guide says values from the tax return "may not accurately measure the economic performance of the farm."
Accrual adjustments move income and expenses into the year the crop was produced or the cost was incurred. The Iowa State guide adjusts for:
- Changes in feed, grain, market livestock and breeding livestock inventories
- Prepaid expenses, such as supplies bought but not yet used and money already put into growing crops
- Accounts payable, such as farm taxes owed
- Accounts receivable, such as patronage dividends you've earned but not received
- Accrued interest and depreciation
If you sold more or less than one year's crop in 2026, or prepaid inputs, this is where it shows. Tennessee's checklist asks for your carryover crops for the same reason and calls them accrual adjustments.
How do you calculate working capital and debt coverage?
Working capital is current assets minus current liabilities. Debt coverage compares the money you had available to pay term debt with the term payments you owed. Kara Schlinke's Know Your Ratios guide for the University of Kentucky (June 2025) spells them out:
- Current ratio: current assets divided by current liabilities.
- Working capital: current assets minus current liabilities. Kentucky gives no benchmark here and says bigger is better.
- Working capital to gross revenues: working capital divided by gross farm income.
- Debt coverage ratio: net farm income, plus non-farm income, depreciation and interest on term debt, minus family living withdrawals and income taxes. Divide that by scheduled principal payments on term debt plus interest on term debt.
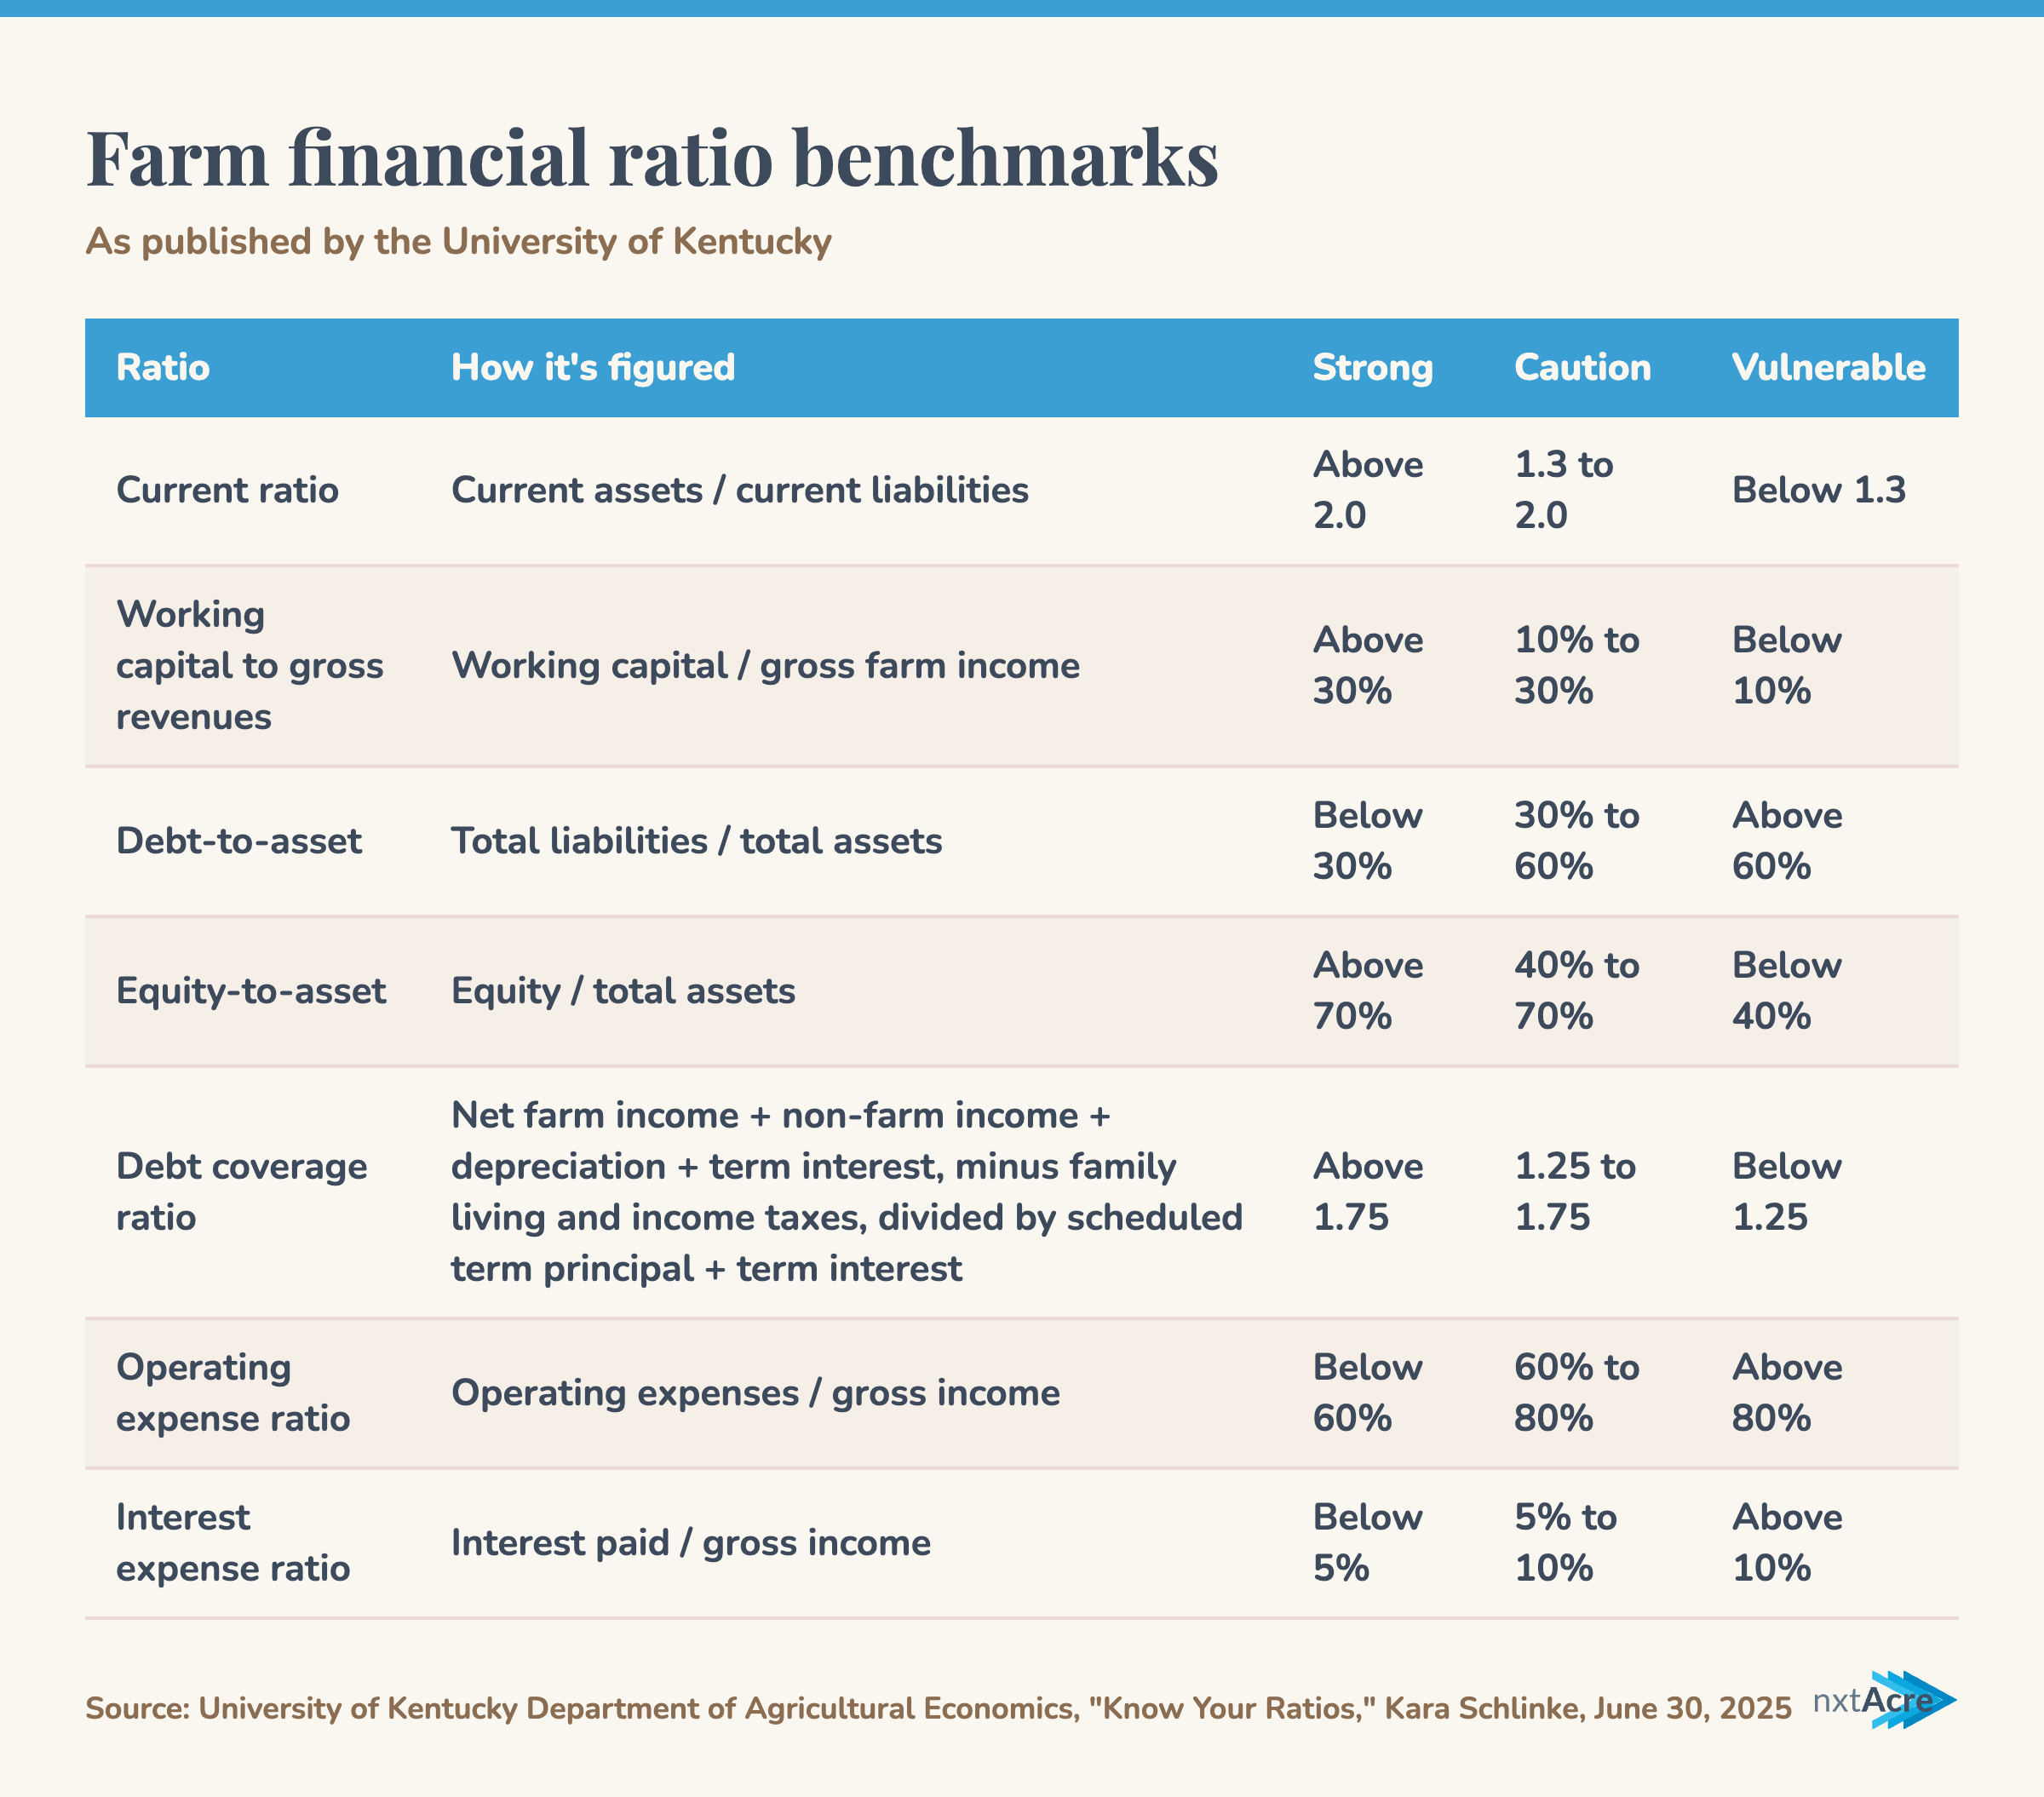
Kentucky calls a current ratio above 2.0 strong, 1.3 to 2.0 caution and below 1.3 vulnerable. For working capital to gross revenues, above 30% is strong and below 10% is vulnerable. For debt coverage, above 1.75 is strong, 1.25 to 1.75 is caution and below 1.25 is vulnerable. On debt coverage, the guide says it plainly: "Lenders love this one."
Not everyone draws the lines in the same place. The Tennessee presentation rates debt service coverage below 1.00 as weak, 1.00 to 1.24 cautionary, 1.25 to 1.49 acceptable, 1.50 to 1.74 good and above 1.75 excellent. Its current ratio scale runs from weak below 1.00 to excellent above 2.50. Ask your lender which yardstick it uses, and run your numbers before the meeting so nothing on its spreadsheet surprises you.
How do you talk to your lender about a bad year?
Early, and with a plan. Tennessee's tips for working with lenders are to start the relationship early, create a narrative, get your records in on time, and talk to your lender if you're in financial distress or something unforeseen happens. The checklist also says to bring up any issues that affected, or may affect, the business's financial performance.
You won't be the only one walking in with a rough year. USDA's Sept. 3 farm income forecast has 2026 net farm income down 5.5% after inflation, with production expenses up $21.2 billion (4.5%) to $492.8 billion.
Smith also lists fixes a lender can work with. For weak repayment capacity: restructure debt, change what you produce, or change production practices. For tight liquidity: a cash injection from family or shareholders, an equity draw, selling equipment or other assets, or refinancing debt.
How a loan is set up matters as much as the rate. In Smith's own example, buying a $50,000 truck on the operating line drops a farm's current ratio from 3.00 to 1.00. Financing the same truck as term debt leaves it at 2.50.
If your bank can't carry you, FSA also guarantees loans made by commercial lenders, at rates those lenders set. Your local USDA Service Center is the place to ask what you'd qualify for, and it's better to ask before you're out of options than after.
Questions and answers
What is a good debt coverage ratio for a farm loan?
The University of Kentucky's Know Your Ratios guide calls a debt coverage ratio above 1.75 strong and below 1.25 vulnerable. A University of Tennessee scale calls 1.25 to 1.49 acceptable and anything below 1.00 weak. Below 1.00 means the money available didn't cover the scheduled term payments.
What current ratio do farm lenders want to see?
Kentucky's guide calls a current ratio above 2.0 strong, 1.3 to 2.0 caution and below 1.3 vulnerable. Tennessee's scale calls 2.00 to 2.49 good and above 2.50 excellent. Ask your lender which scale it uses.
Are FSA operating loans cheaper than bank loans right now?
FSA's direct operating rate is 5.625% for November 2026, while Chicago Fed district banks averaged 7.12% on operating loans in the second quarter. FSA's direct loans are for eligible producers, and FSA also guarantees loans that commercial lenders make at their own rates. Your local USDA Service Center can walk you through the options.
Should I give my lender my tax return or accrual numbers?
Both. Tennessee's checklist asks for tax returns and an income statement, and Iowa State's guide explains that tax return values may not measure how the farm actually performed. The accrual-adjusted statement corrects for inventory changes, prepaid expenses, payables, receivables, accrued interest and depreciation.