71% of U.S. farms run on a margin under 10%. What that number really says
Published · 5 min read
Seventy-one percent. That's the share of U.S. farms with an operating profit margin under 10% in 2024, according to USDA's America's Farms and Ranches at a Glance: 2025 Edition, published Feb. 10, 2026. It was 69% the year before. USDA's Economic Research Service files every one of those farms under "high risk."
That sounds like most of American agriculture is going broke. It isn't, quite. The number is real, but what it measures is narrower than the headline, and it's worth knowing exactly what goes into it before you compare your own place to it.
What is an operating profit margin?
It's the share of a farm's gross income that's left as profit after the farm pays for everything, including the people who don't get a paycheck. The full report gives the formula:
100 × (net farm income + interest expense minus returns to unpaid labor and management) ÷ gross farm income
Each piece does a job:
- Interest is added back, so a farm isn't marked down just because it borrowed to buy land or equipment. The ratio looks at the operation, not the financing.
- Returns to unpaid labor and management come out. That's a charge for the work you, your spouse and your kids do without wages. A farm that only breaks even because nobody in the family is paid shows up with a low margin, and that's the point.
- Gross farm income is the whole top line. The report notes it can even go negative when inventory loses value, and ERS doesn't calculate the ratio for those farms.
ERS then sorts farms into three groups: low risk above 25%, medium risk from 10% to 25%, and high risk below 10%.
Which farms are in the high-risk zone?
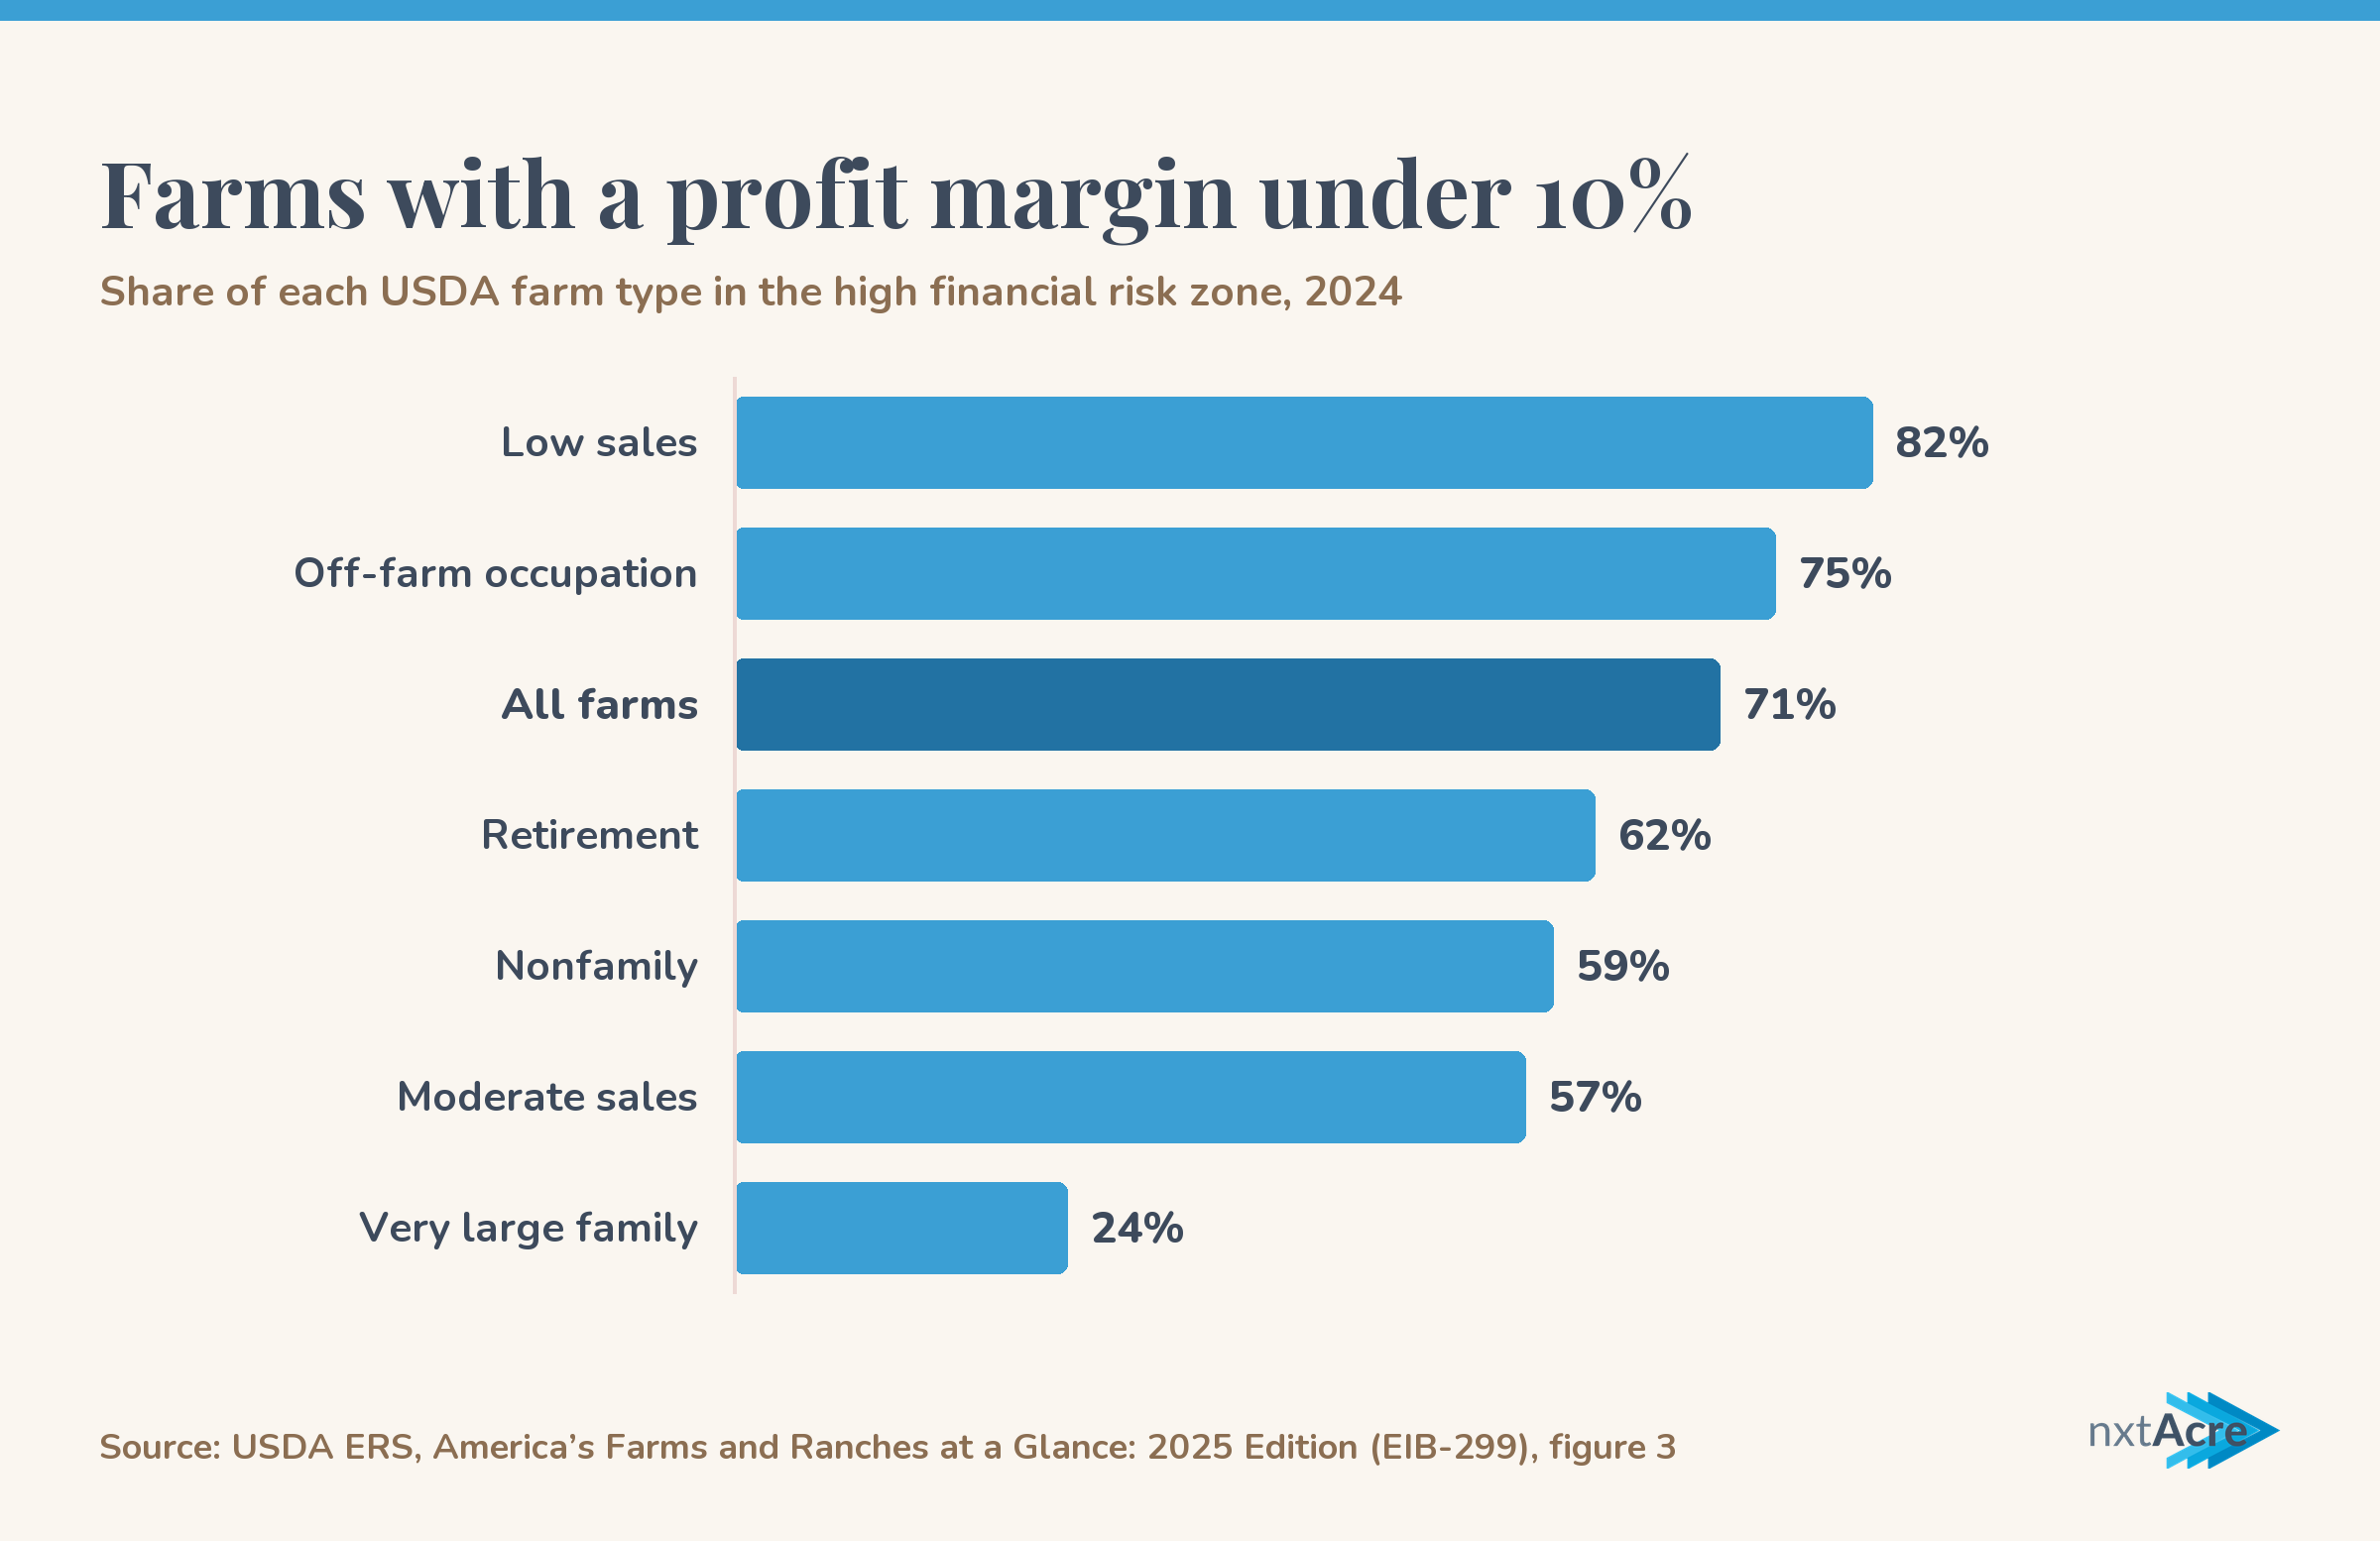
Mostly small ones, but not only small ones. ERS sorts family farms by gross cash farm income (GCFI), and the high-risk share falls as farms get bigger. These figures are for 2024, from the report:
| Farm type | Gross cash farm income | Share under 10% margin |
|---|---|---|
| Retirement (small) | Under $350,000 | 62% |
| Off-farm occupation (small) | Under $350,000 | 75% |
| Low sales (small) | Under $150,000 | 82% |
| Moderate sales (small) | $150,000 to $349,999 | 57% |
| Very large family | $5 million or more | 24% |
| Nonfamily | Any | 59% |
| All farms | 71% |
The report says midsize ($350,000 to $999,999) and large family farms were more likely than small farms to be in the medium and low-risk groups, and that very large family farms were the strongest, with 76% in low or medium risk. It also flags a shift worth watching: a bigger share of midsize family farms slid into the high-risk zone in 2024 than in 2023, and fewer were in the low-risk zone.
How do most farm families get by on that?
With a job in town, mostly. Across all family farms, 86% of households earned more than half their income off the farm, and for retirement, off-farm occupation and low-sales farms it was at least 90%.
The averages in the report's household income table make it plain. The average family farm household had $159,300 in total income in 2024, and $128,000 of it came from off the farm. Farming contributed $31,300. Off-farm occupation farms averaged a $9,300 loss from farming, and low-sales farms a $4,200 loss.
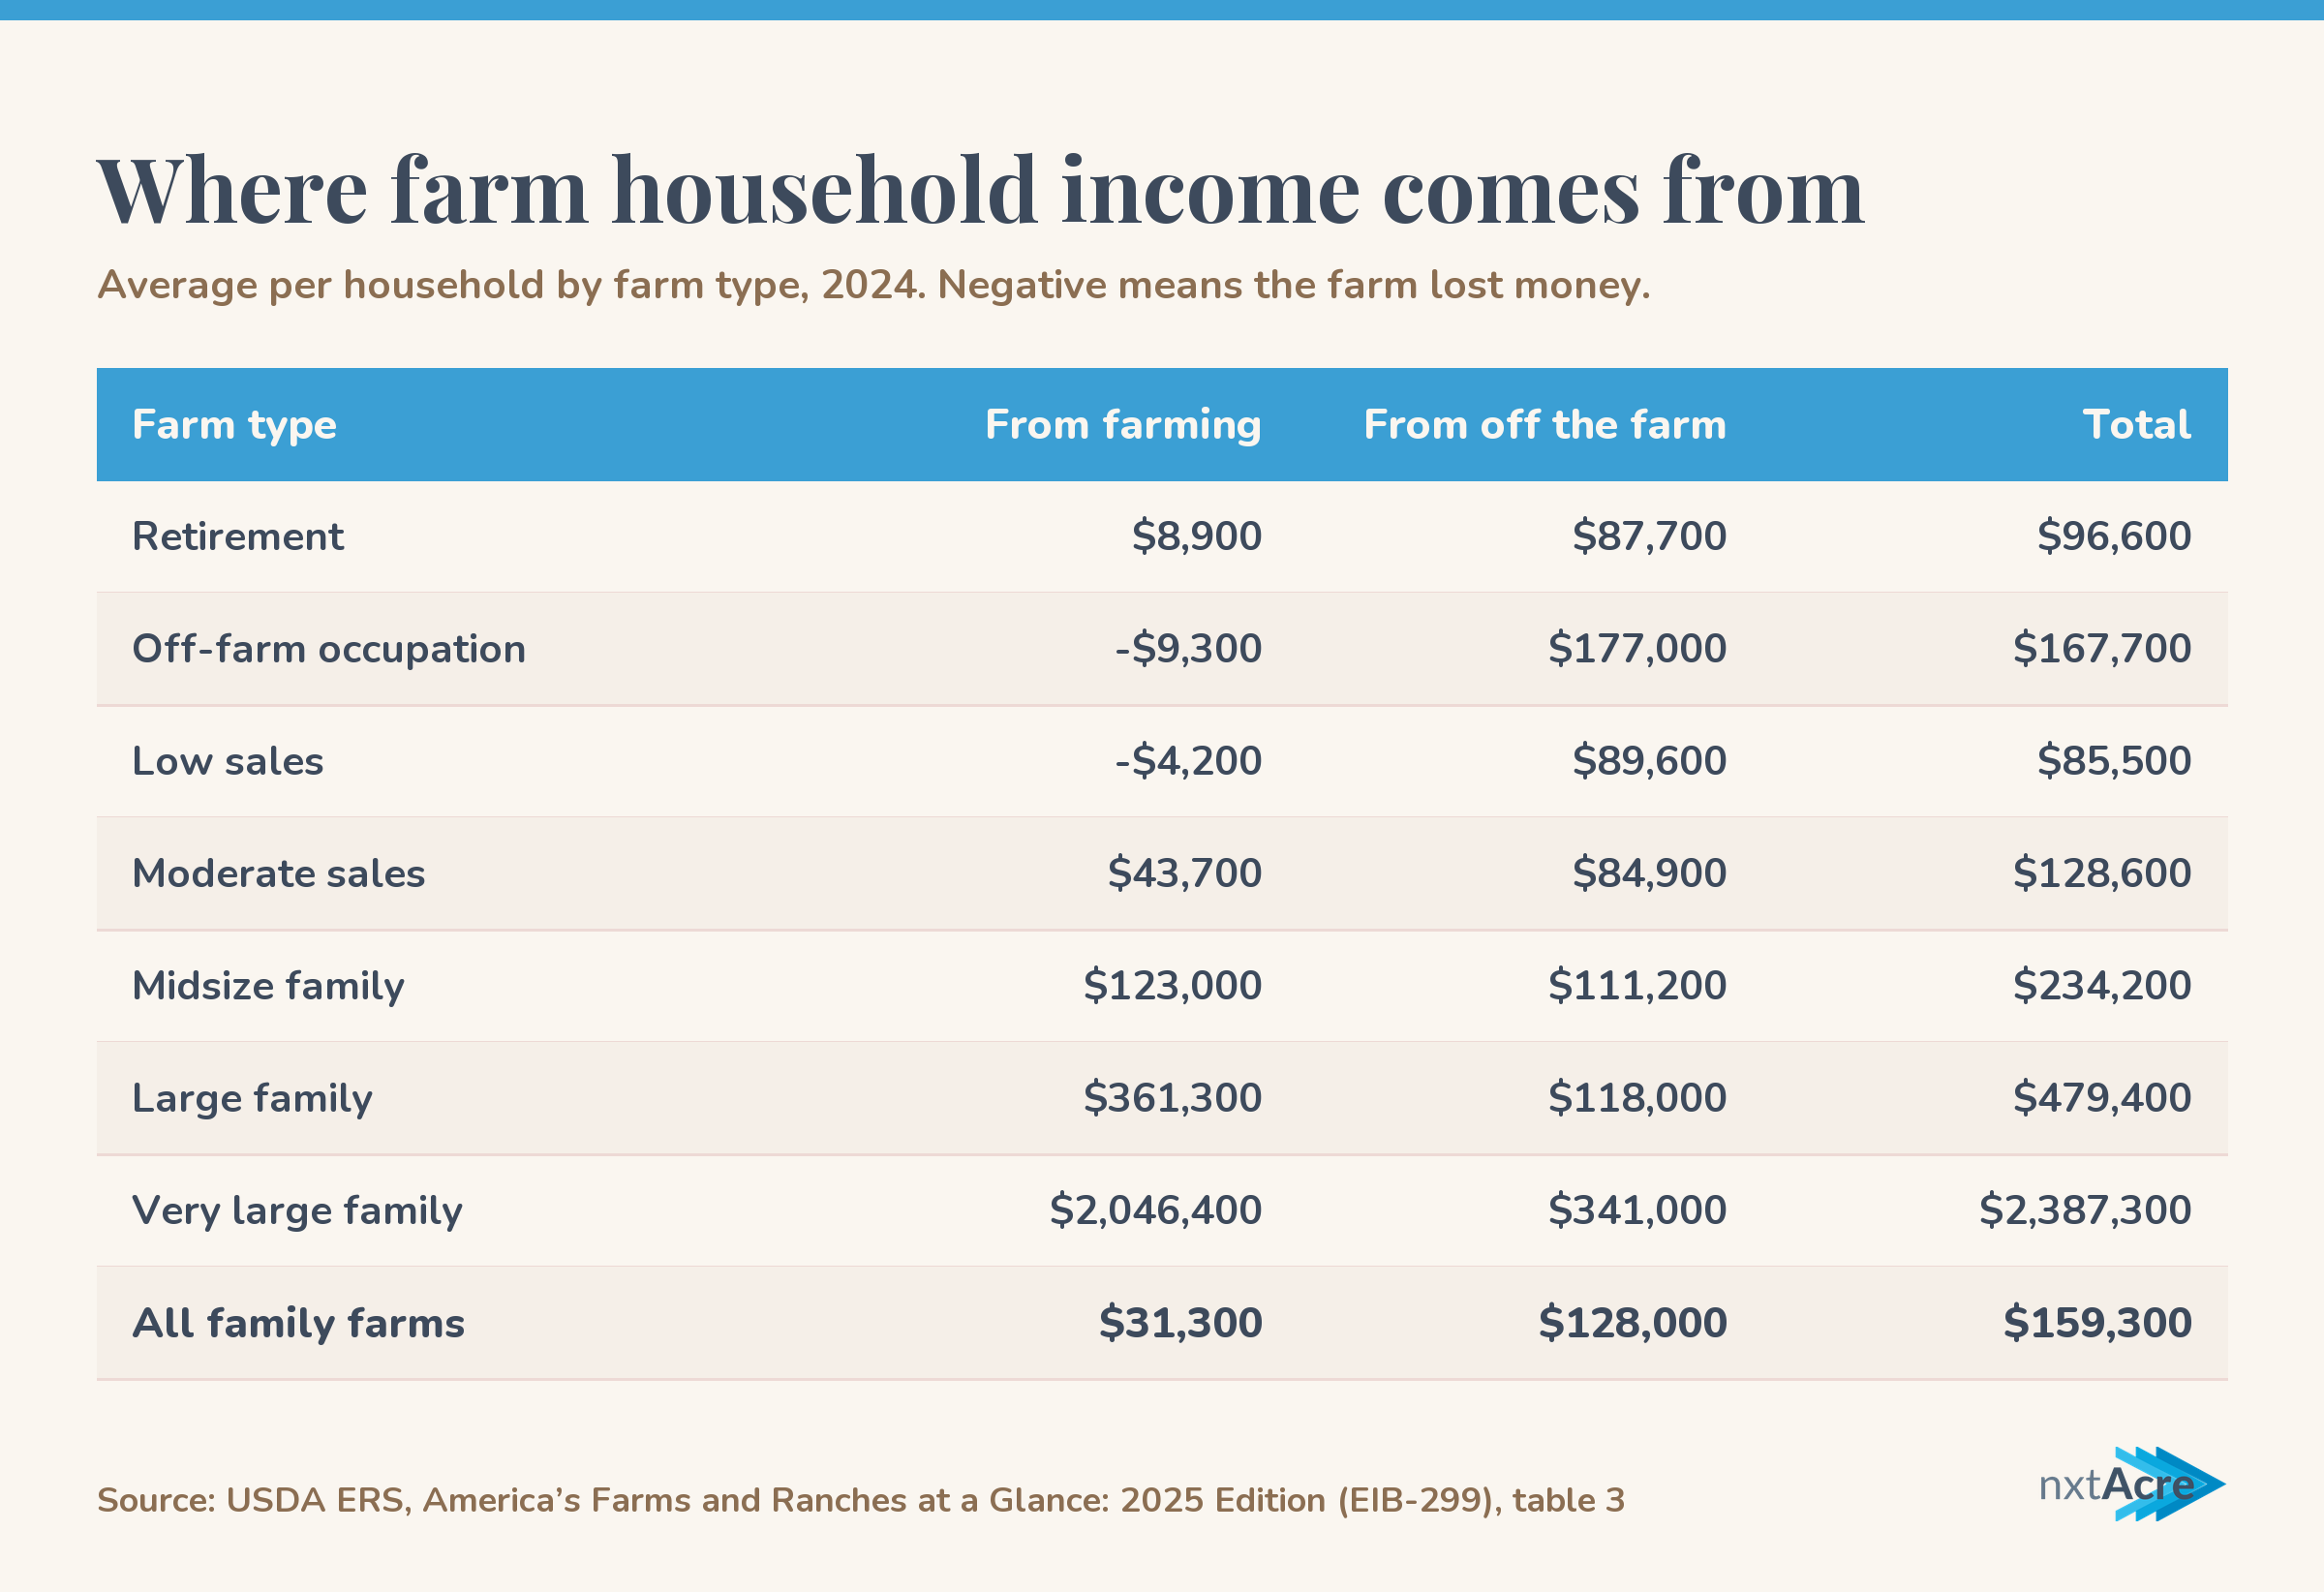
Losing money farming is common at the small end. In 2024, 68% of off-farm occupation farms, 63% of low-sales farms and 52% of retirement farms reported losses from the farm operation. Among moderate-sales farms, where the farm is the main job, it was 24%.
And yet these households aren't poor on paper. The report found 42% of family farm households had income below the U.S. median of $83,730, but only 2% had wealth below the U.S. median. As ERS puts it, income differences between farm types are more pronounced than differences in wealth.
Does a low margin mean a farm is failing?
Not by itself. ERS calls it financial vulnerability, and it is, but a lot of those 71% are places where farming isn't the main income and was never meant to be. Off-farm occupation farms alone were 39% of all U.S. farms in 2024. For those farms, a thin margin says the farm can't stand on its own. It doesn't say the household is in trouble.
It also helps to know where the production is. Small family farms were 86% of farms and operated 40% of the land, but produced 17% of the value of U.S. farm production. Large-scale family farms, those with $1 million or more in GCFI, were 5% of farms and produced 50%.
Where a low margin should worry you is when the farm is supposed to be the living. If you're a moderate-sales or midsize operation and you're under 10% year after year, there's less room for a bad price, a wreck or a dry summer before the operating line gets tight.
How do I figure out my own operating profit margin?
You need four numbers for the year, and three of them come out of your books:
- Gross farm income: everything the farm brought in, including government payments and other farm income. If you can, adjust for inventory you built up or sold down, since a year you sold out of the bin looks better on cash than it really was.
- Net farm income: gross income minus all farm expenses, including depreciation.
- Interest expense: what you paid on farm loans. Add it back.
- A value for your own unpaid labor and management: this one is a judgment call. Use what you'd have to pay someone to do the work you and your family do for free.
Add interest to net farm income, take off your labor and management charge, divide by gross farm income and multiply by 100. Then compare it to ERS's lines at 10% and 25%. Your lender may use slightly different definitions, so ask how they calculate it before you hand them a number.
The whole-farm number can hide a lot. One enterprise can carry the rest of the place, and another can drag it down. nxtAcre's Enterprise P&L breaks income, expenses, net and cost of production out by field, crop or class per acre, and by herd per head, so you can see which part of the operation is pulling its weight. It won't compute ERS's ratio for you, but it gives you the pieces.
Questions and answers
What percent of farms have a profit margin under 10%?
USDA's Economic Research Service found 71% of U.S. farms had an operating profit margin below 10% in 2024, up from 69% in 2023. ERS places those farms in its high financial risk category.
How does USDA calculate operating profit margin?
ERS uses 100 times net farm income plus interest expense minus returns to unpaid labor and management, divided by gross farm income. Above 25% is low risk, 10% to 25% is medium risk, and below 10% is high risk.
How much of farm household income comes from off the farm?
In 2024, 86% of family farm households earned more than half their income off the farm. The average family farm household had $159,300 in total income, with $128,000 from off-farm sources and $31,300 from farming.
Are most farms losing money?
Most small family farms that aren't the household's main business reported farm losses in 2024: 68% of off-farm occupation farms, 63% of low-sales farms and 52% of retirement farms. Among moderate-sales farms, where farming is the main occupation, 24% reported losses.