Farm income falls 5.5% in 2026, but not for everyone
Published · 6 min read
How much is farm income down in 2026?
USDA's Economic Research Service forecasts 2026 net farm income at $158.4 billion. That's $4.3 billion (2.6%) below 2025 before inflation and $9.1 billion (5.5%) below it after, according to the Sept. 3 forecast. USDA's next update is due Dec. 2.
Net cash farm income, which leaves out noncash items like inventory changes and depreciation, is forecast at $176.4 billion. That's up 0.4% in nominal dollars and down 2.5% after inflation.
Two things get lost in the headline. The September number is better than ERS's February forecast: the Feb. 5 data release had 2026 net farm income at $153.4 billion. And even after the drop, ERS says both measures stay above their 2006 to 2025 averages in inflation-adjusted dollars.
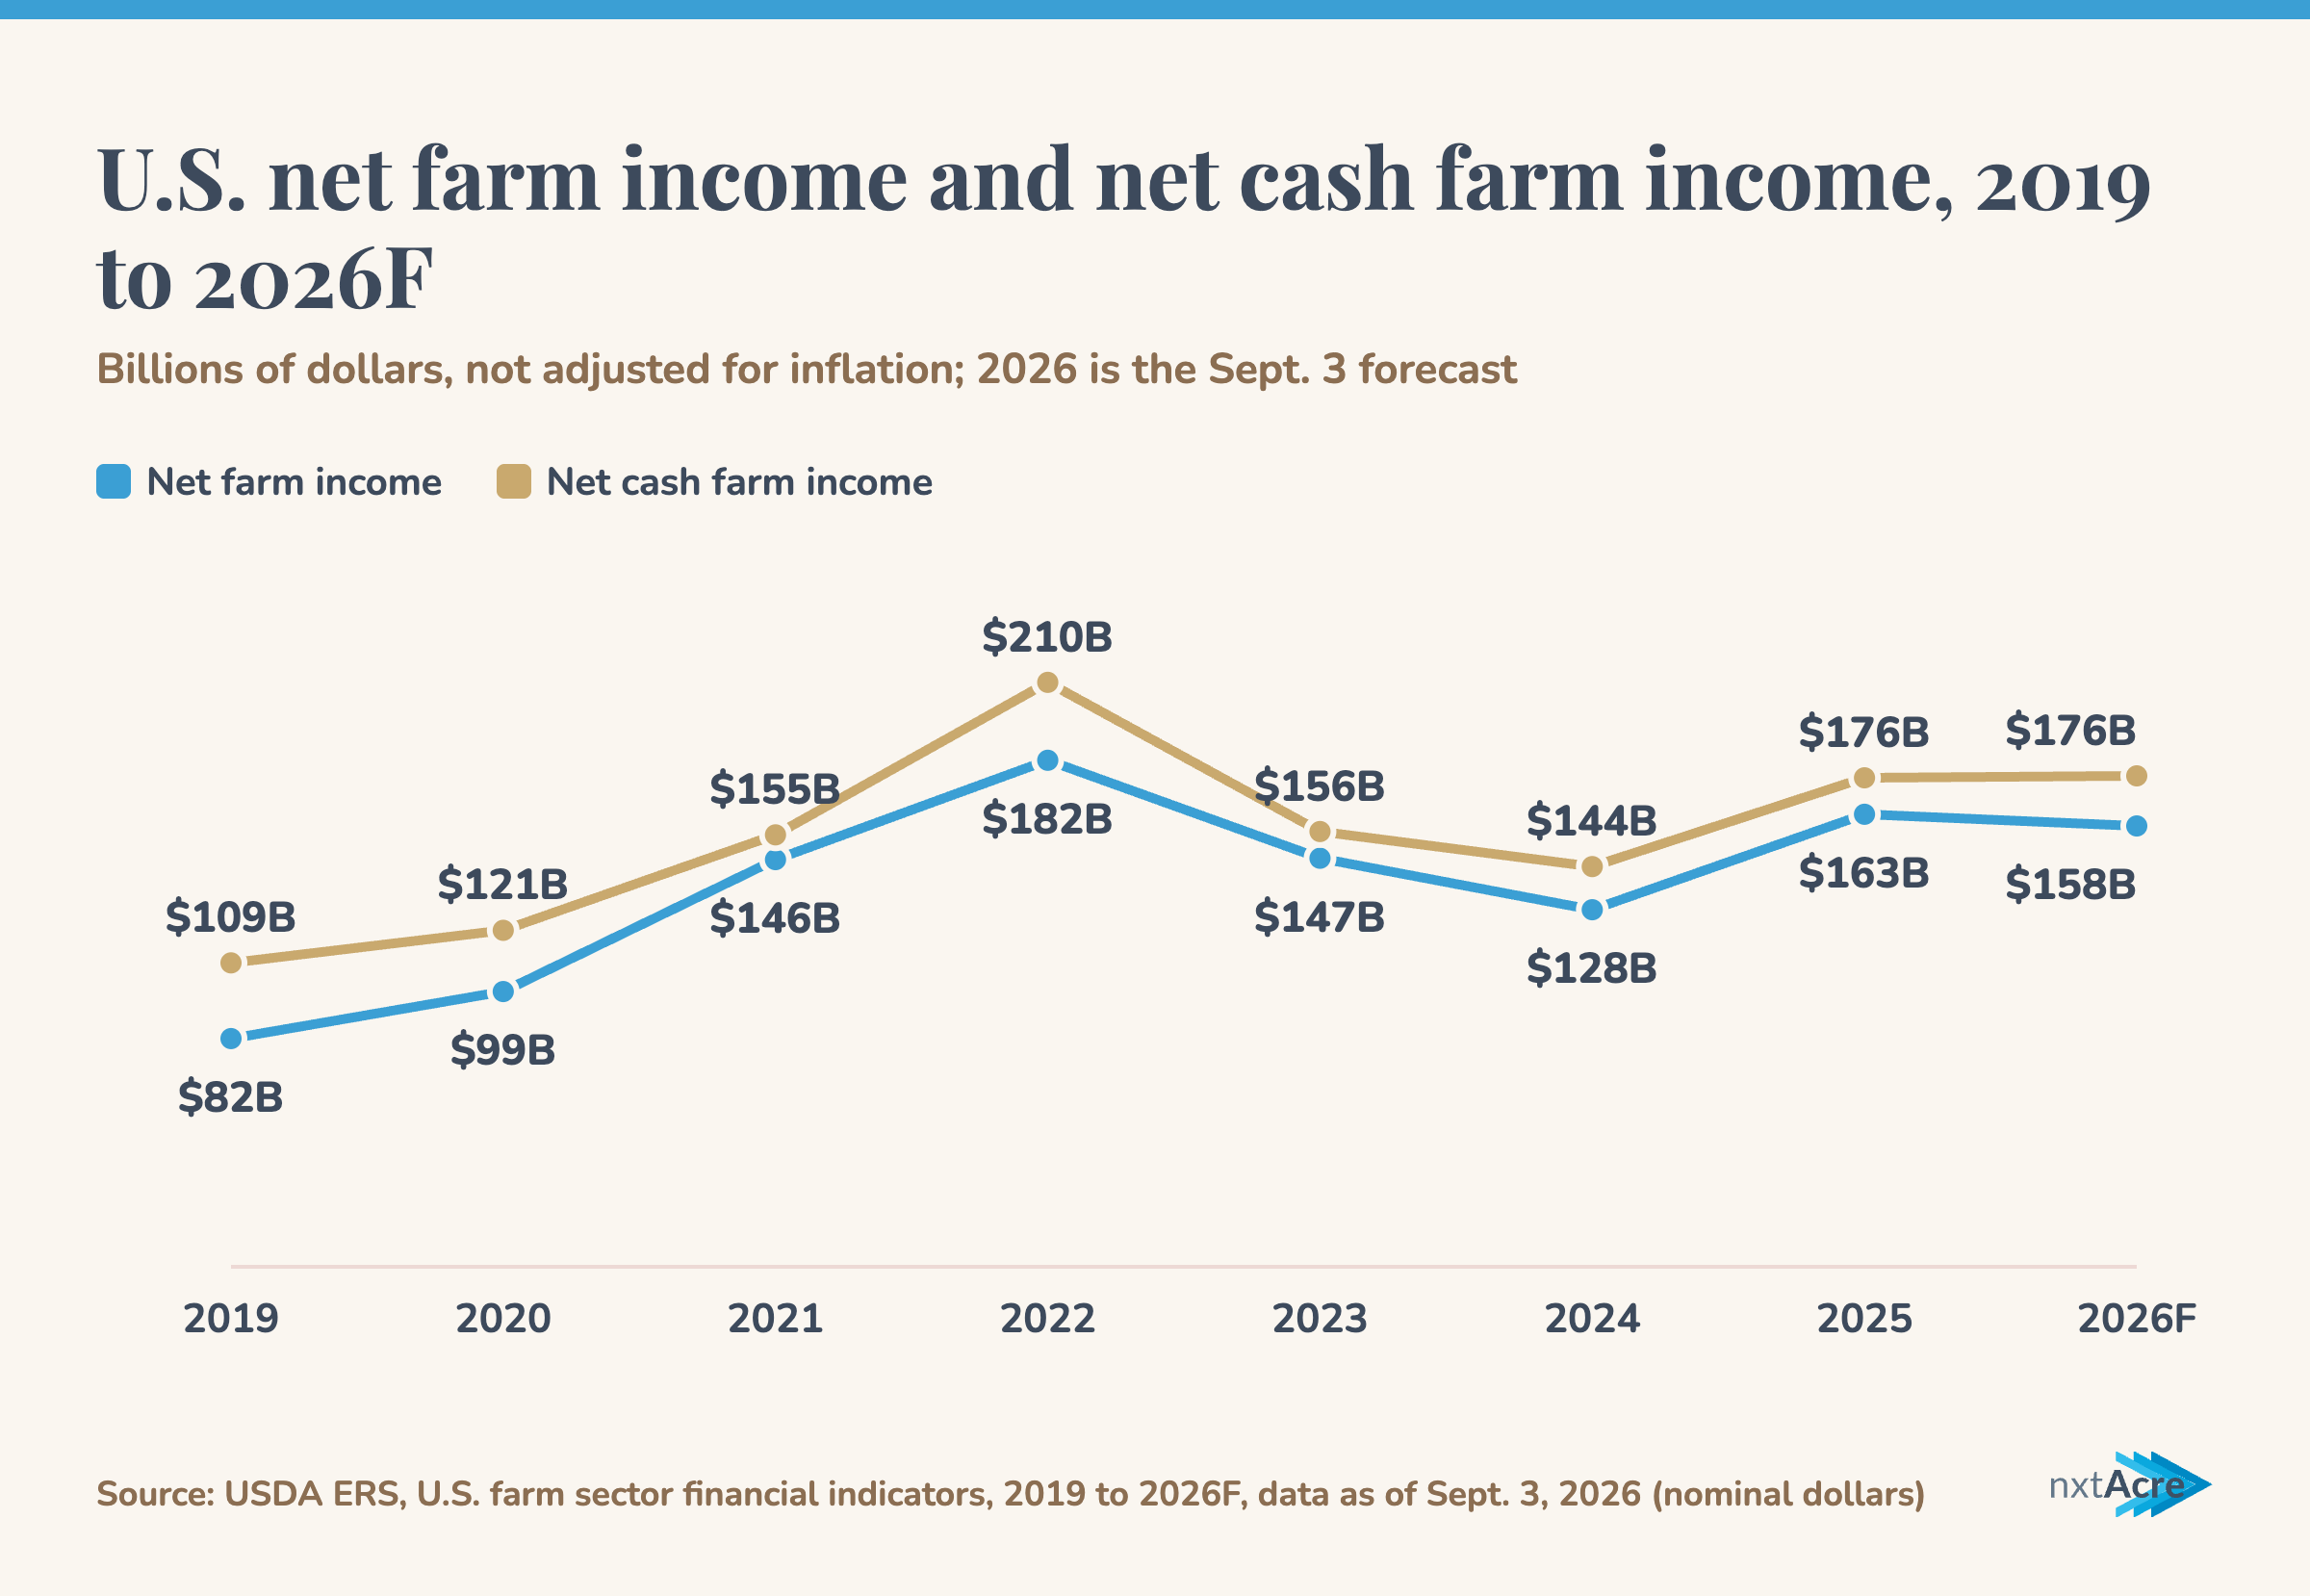
The comparison year was a big one. In ERS's financial indicators table, 2025 net farm income of $162.6 billion was up 26.7% from 2024. The question that matters more for your own farm is which kinds of operations are getting the money in 2026.
Where the money is coming from: crops up, eggs down
Crop cash receipts are forecast at $253.0 billion, up $14.6 billion (6.1%), per the full forecast. Corn receipts rise $6.8 billion, mainly because more bushels are sold. Soybean receipts rise $4.3 billion, mainly on price. Cotton is up $0.7 billion and vegetables and melons $3.8 billion, while rice, sugarbeet and sugarcane receipts fall.
Animal and animal product receipts are forecast at $287.3 billion, down $16.4 billion (5.4%). Eggs account for more than that whole decline: egg receipts are forecast down $20.9 billion (66.3%). Milk is down $2.1 billion and hogs $1.2 billion.
Cattle and calves go the other way. Receipts are forecast up $7.0 billion (5.2%), and ERS expects cattle prices to keep rising in 2026.
Costs ate a good share of the gains. Total production expenses are forecast at $492.8 billion, up $21.2 billion (4.5%). Livestock and poultry purchases rise $7.4 billion (11.4%) to $71.9 billion, which ERS says would put them ahead of feed ($69.5 billion) as the largest single expense category for the first time. Fertilizer, lime and soil conditioner spending is up $5.3 billion (15.3%) and fuel and oil $4.8 billion (28.8%). Pesticide spending is down $1.4 billion (6.6%).
How much of farm income is government money?
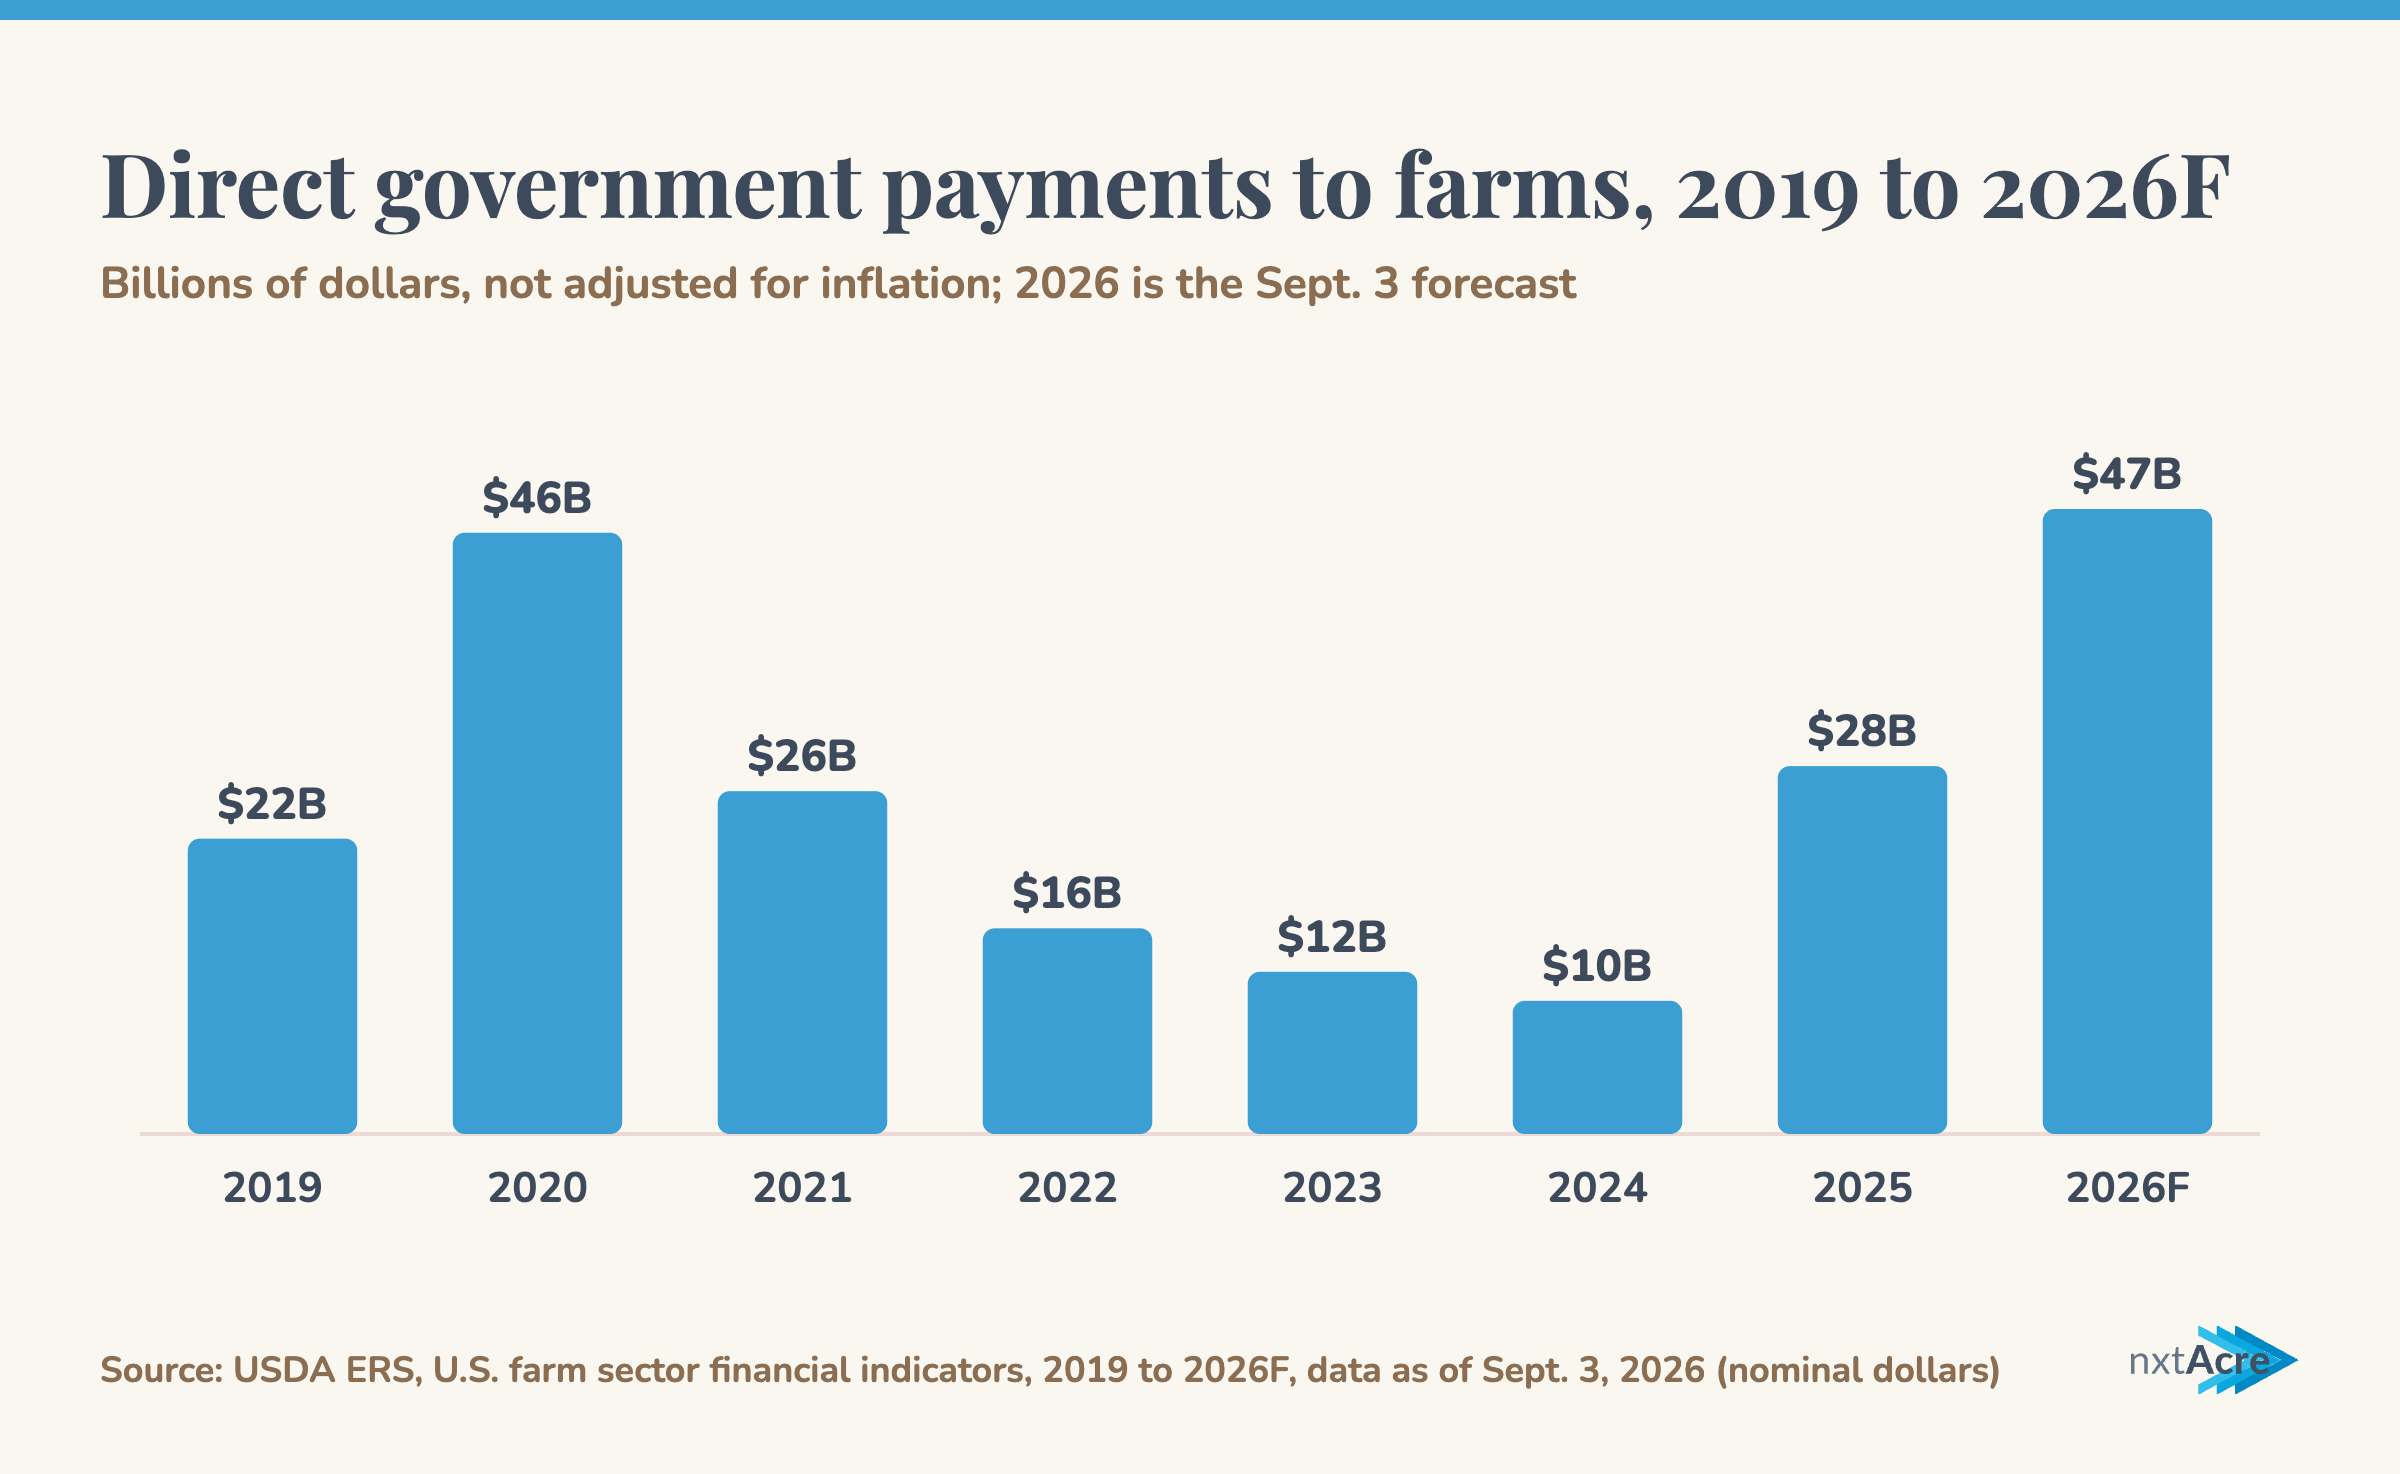
A lot. Direct government payments are forecast at $47.4 billion in 2026, up $19.5 billion (69.8%) from $27.9 billion in 2025. Next to the $158.4 billion net farm income forecast, that's about 30%.
ERS adds a caution to that comparison. A note in its indicators table says the payment totals include money paid to landlords, and the nonoperator landlords' share is offset through rent expense, so it isn't counted in net farm income.
In ERS's government payments data, which goes back to 1933, $47.4 billion is the largest annual total in nominal dollars. The next largest is 2020, at $45.6 billion.
Where it comes from matters, because not all of it repeats:
- $26.5 billion in supplemental and ad hoc disaster aid, up $5.3 billion, mainly the Farmer Bridge Assistance Program and Supplemental Disaster Assistance under the American Relief Act of 2025
- $15.6 billion from farm bill programs tied to prices or revenue, up $13.4 billion because of the One Big Beautiful Bill Act's changes to 2025-crop ARC and PLC
- $5.3 billion in conservation payments
The biggest piece is the supplemental and ad hoc aid. We wouldn't build a 2027 budget around getting that again.
Which types of farms are doing better in 2026?
Crop farms, mostly. ERS forecasts average net cash farm income for farm businesses at $121,700, up 7.1%, but the breakdown by specialization is where it gets useful:
| Farm business specialization | Average net cash farm income, 2026F | Change from 2025 |
|---|---|---|
| Dairy | $477,500 | -12% |
| Hogs | $395,800 | -10% |
| Cotton | $370,700 | +24% |
| Corn | $306,100 | +46% |
| Specialty crops | $286,700 | -3% |
| Wheat | $125,300 | +189% |
| Soybeans | $112,000 | +44% |
| Other crops | $89,000 | +21% |
| Cattle/calves | $50,300 | 0% |
| Poultry/eggs | -$3,400 | -102% |
Wheat's 189% jump works out to $81,900 per farm. By region, the Northern Great Plains gets the biggest gain, 30% ($50,700) to $217,000 a farm, and ERS credits that largely to higher direct government payments.
The cattle line surprises people. Receipts are up and ERS expects cattle prices to keep climbing, yet the average cattle operation's cash income is flat. ERS doesn't explain that on its farm business page. Our read is that the expense side is part of it: livestock and poultry purchases are forecast up $7.4 billion, and for an operation that buys cattle, higher prices are a cost before they're income.
Why your own enterprise numbers matter more than the national average
A national average describes nobody. ERS puts a farm business in a specialization when at least 50% of its value of production comes from that commodity, and it notes that farms often produce several commodities. So a "corn farm" in that table may also run soybeans and a cow herd, and its income doesn't all come from corn.
The question to answer for yourself before winter meetings is which of your fields and enterprises made money on their own, and which only broke even because of a payment that may not come again. Do it with your numbers, not the national ones: your yields, your bids after basis, your rent.
In nxtAcre, the Enterprise P&L report under Finances → Reports splits income and expenses by field, crop, class or herd, so the cow herd and the grain each carry their own costs.
What to watch on Dec. 2 and into 2027
ERS releases its next farm income forecast on Dec. 2 at 11 a.m. Eastern. ERS says its forecasts reflect USDA's commodity outlook in the latest WASDE, and the Oct. 9 WASDE lowered the 2026/27 season-average corn price 10 cents to $4.70 and left soybeans at $12.00.
Those prices matter for 2027 cash flow. farmdoc daily’s Oct. 27 analysis puts the 2026 PLC effective reference prices at $4.42 for corn and $10.71 for soybeans, and says no PLC payment would be triggered for corn at the current price projection. Soybeans at $12.00 are well above their reference price. The ARC benchmark prices are $5.03 for corn and $12.17 for soybeans, and farmdoc expects ARC-CO to trigger larger payments than PLC on corn and soybean base acres. The 2026 election deadline is Dec. 11.
Either way, any 2026-crop payment won't be received until October 2027. That gap is the practical problem: your 2027 operating line has to carry you through a year when the 2026 payment is a maybe and further ad hoc aid is unknown. We'd budget 2027 with both as upside, not as the plan.
Questions and answers
What is USDA's 2026 net farm income forecast?
The Sept. 3, 2026 forecast puts net farm income at $158.4 billion, down 2.6% from 2025 in nominal dollars and 5.5% after inflation. Net cash farm income is forecast at $176.4 billion. USDA's next update is due Dec. 2.
Are 2026 government payments to farmers a record?
In nominal dollars, the $47.4 billion forecast is the largest annual total in ERS's government payments data, which goes back to 1933. The next largest is 2020, at $45.6 billion. ERS's forecast doesn't compare the two after inflation.
Why is livestock income down if cattle prices are high?
Eggs drive the drop. Egg receipts are forecast to fall $20.9 billion, more than the $16.4 billion decline in all animal receipts. Cattle and calf receipts are forecast up $7.0 billion, though ERS has the average cattle operation's net cash income flat at $50,300.
When will 2026 ARC and PLC payments be paid?
farmdoc daily notes that any payments triggered for the 2026 crop year won't be received until October 2027. ARC-CO combines county yields with the marketing-year average price, and PLC pays only if that price falls below the effective reference price. The 2026 election deadline is Dec. 11, and your FSA office can tell you what your farm is enrolled in.